

Authors - Soheil Esmaeilzadeh, Amir Salehi, Gill Hetz, Feyisayo Olalotiti-lawal, Hamed Darabi, and David Castineira
Abstract - Representing the reservoir as a network of discrete compartments with neighbor and non-neighbor connections is a fast, yet accurate method for analyzing oil and gas reservoirs. Automatic and rapid detection of coarse-scale compartments with distinct static and dynamic properties is an integral part of such high-level reservoir analysis. In this work, we present a hybrid framework specific to reservoir analysis for an automatic detection of clusters in space using spatial and temporal field data, coupled with a physics-based multiscale modeling approach. A novel and rigorous non-local formulation for flow in porous media is presented, in which the reservoir is represented by an adjacency matrix describing the connectivities of comprising compartments. We automatically divide the reservoir into a number of distinct compartments, in which the direction-dependent multiphase flow communication is a function of non-local phase potential differences. Our proposed clustering framework begins with a mixed-type raw dataset which can be categorical/numerical, spatial/temporal, and discrete/continuous. The dataset can contain noisy/missing values of different data types including but not limited to well production/injection history, well location, well type, geological features, PVT measurements, perforation data, etc. Unsupervised clustering techniques suited to the input data types (e.g. k-prototypes, spectral, Gaussian Mixtures, and hierarchical clustering), and appropriate distance measures (such as Euclidean distance, soft dynamic time warping, and mode) are used. The input data is standardized, and upon convergence check, the best clustering representation is obtained. Finally, Support-Vector-Machine technique is utilized in the kernel space to trace a demarcating hyperplane for the clusters. In a specific case study reported here, the proposed workflow is applied to a major field with a couple of hundreds of wells with more than 40 years of production history. Leveraging the fast forward model, an efficient ensemble-based history matching framework is applied to reduce the uncertainty of the global reservoir parameters such as inter-blocks and aquifer-reservoir communications, fault transmissibilities, and block-based oil-in-place. The ensemble of history matched models are then used to provide a probabilistic forecast for different field development scenarios. In addition, the clustering framework enables us to treat missing data and use the augmented dataset for improving the clustering accuracy. In summary, in this work a novel hybrid approach is presented in which we couple a physics-based non-local modeling framework with data-driven clustering techniques to provide a fast and accurate multiscale modeling of compartmentalized reservoirs. This research also adds to the literature by presenting a comprehensive work on spatio-temporal clustering for reservoir studies applications that well considers the clustering complexities, the intrinsic sparse and noisy nature of the data, and the interpretability of the outcome.
Keywords: Machine learning, Artificial intelligence, Spatio-temporal clustering, Non-local multi-scale flow formulation, Reservoir modeling
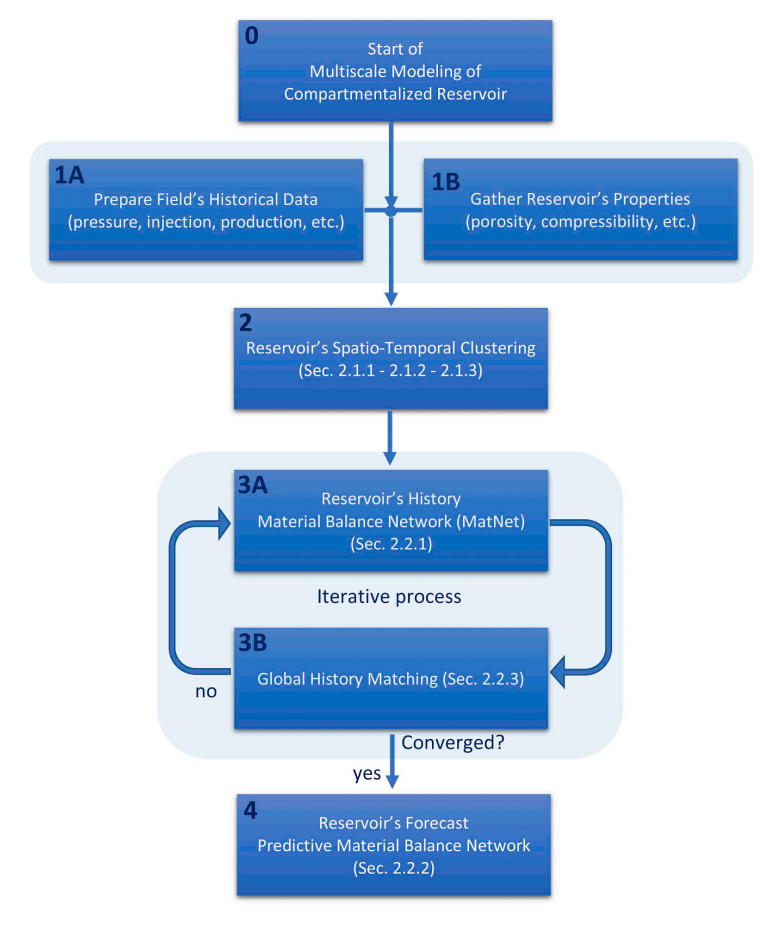
Fig.1. Flowchart showing the order of steps for multiscale modeling of compartmentalized reservoir - (0). Start. (1A). Field's historical data (e.g. pressure data, injection data, production data, recovery schedule, saturation profiles, etc.) get prepared. (1B). Reservoir's properties are gathered (e.g. porosity, compressibility, permeability data, initial oil, gas, and water in place, initial pressure, initial saturation, etc.) (2). Carrying out spatio-temporal clustering as discussed in sections 2.1.1. through 2.1.3. of the paper. (3A). Calculating reservoir's historical pressure profiles using the approach proposed in section 2.2.1. of the paper. (3B). Carrying out global history matching to decrease the historical pressure's mismatch and finding history matched quantities of any uncertain properties (such as transmissibilities, initial oil in places, etc.) (4). Performing predictive material balance as proposed in section 2.2.2. of the paper.
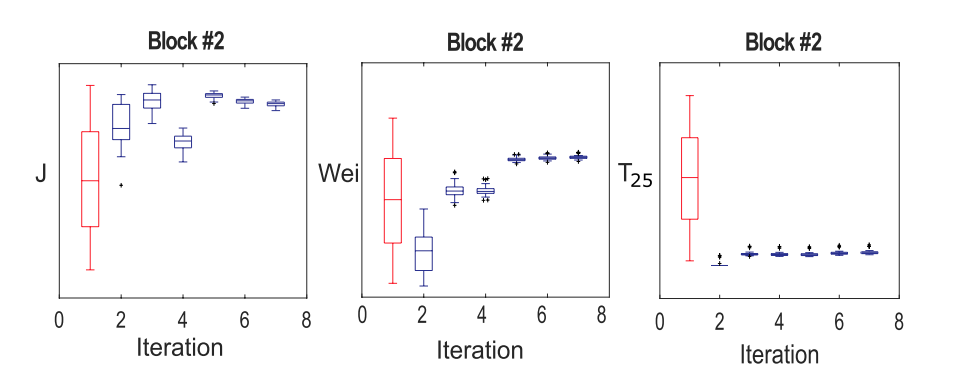
Fig.4. Block #2 in Fig. 3 box plots of: left: the supporting aquifer's transmissibility ($J$), middle: maximum volume of water encroachable from its supporting aquifer ($W_{ei}$), and right: transmissibility with the adjacent block #5 ($T_{25}$) as the function of number of iterations during the history matching process.
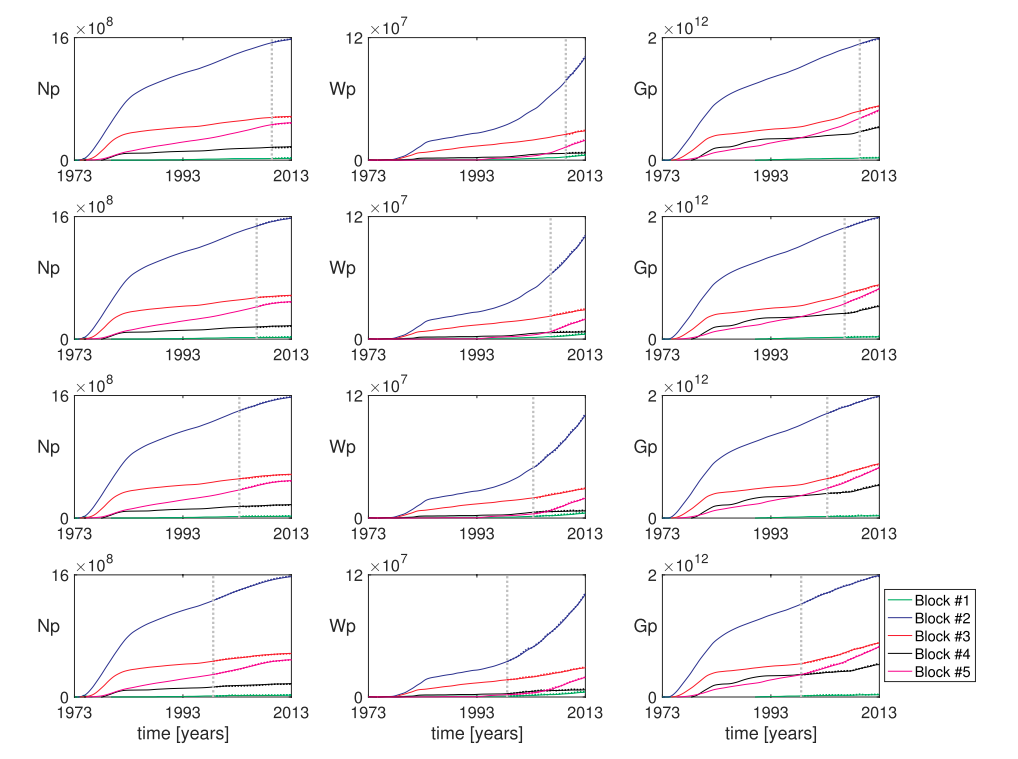
Fig.5. Comparison of predictive material balance results for oil, water, and gas production curves in a blind test study with blind test ratios of (90%–10%), (80%–20%), (70%–30%), and (60%–40%) (respectively from top to bottom) - the vertical gray dotted lines show the start of forecast, the overlaid dashed lines show the forecast and solid lines show the actual ground truth historical values - $N_p$, $W_p$, $G_p$ are respectively cumulative volume of oil, water, and gas produced.
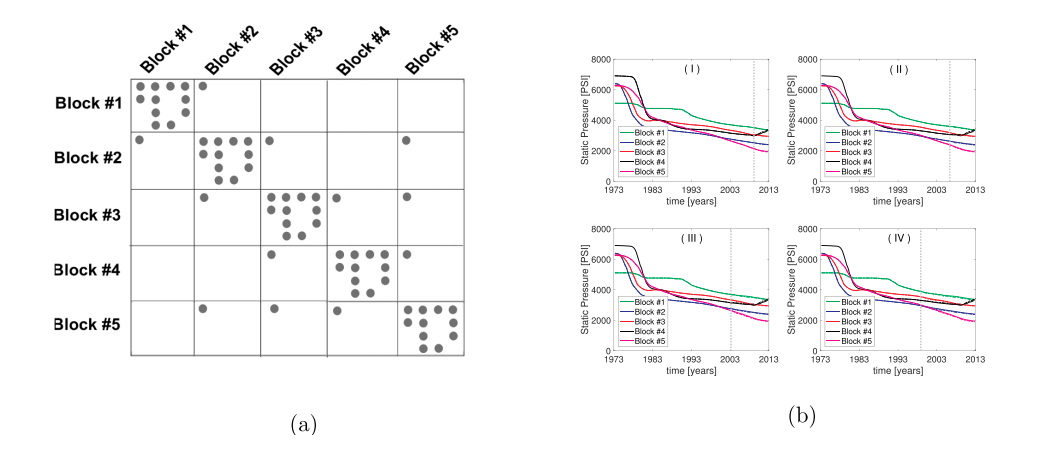
Fig.6. (a). Jacobian matrix structure for the 5-compartment clustered reservoir of Fig. 3 for multi-tank predictive material balance - gray circles represent the nonzero elements in the Jacobian matrix. (b). Validation of the forecast approach - last 10% (I), 20% (II), 30% (III), and 40% (IV) of the historical data is masked and compared with the forecast's pressure solution for the 5-compartment clustered reservoir of Fig. 3 - the vertical gray dotted lines show the start of forecast, the overlaid dashed lines show the forecast and solid lines show the actual ground truth historical values.